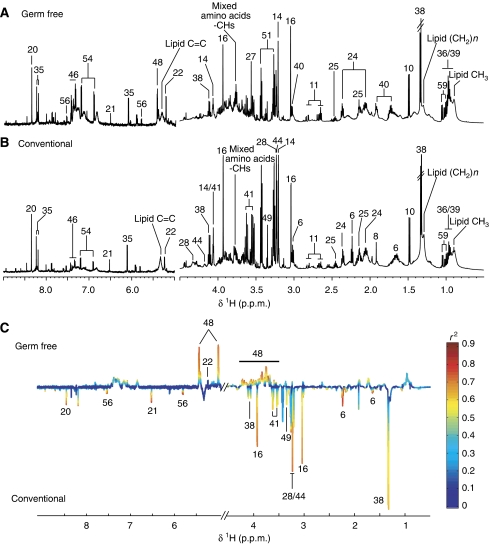
Figure 5.
1H NMR spectra (600 MHz) of colon aqueous extracts of germ-free (GF) (A) and conventional (B) mice. The aromatic region (δ 6.5–9.0) has been vertically expanded × 4. (C) Plot of O-PLS-DA coefficients related to the discrimination between 1H NMR spectra of urine from GF (top) and conventional (bottom) mice. For identification of the peak numbers, refer to codes in Table II.

