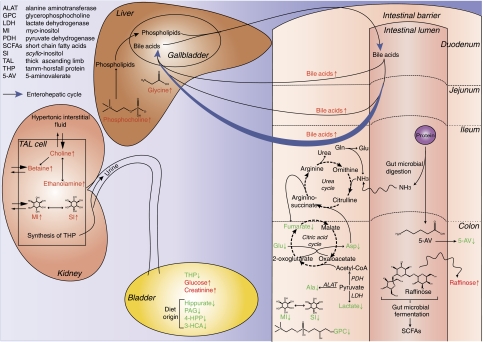
Figure 7.
Summary of some of the major systemic effects of the gut microbiome on mouse metabolism in different compartments. Metabolites observed in this study are shown in red when their level is higher in GF profiles or in green when it is lower. The enterohepatic cycle of bile acids is shown as blue arrows. The citric acid cycle has been simplified for clarity.

