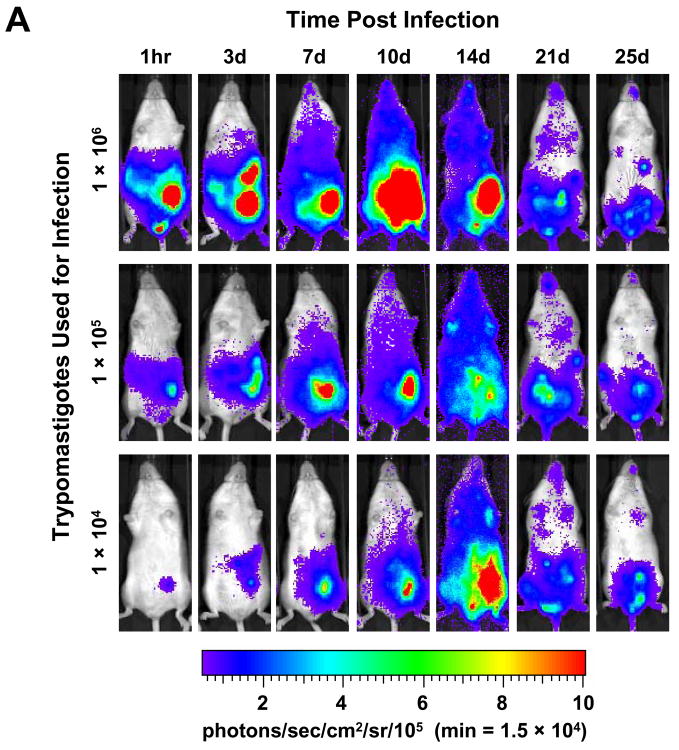
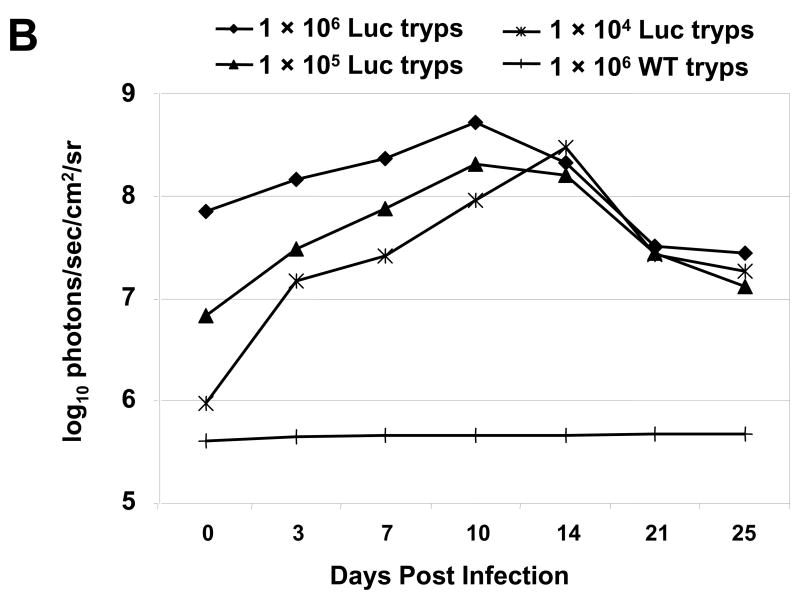
Fig. 2.
Luminescent T. cruzi imaged at various times p.i. with an IVIS imaging system. (A) Trypomastigotes were isolated from in vitro myoblast infections and different amounts, as indicated, were injected i.p. into A/J mice. Mice were imaged ventrally starting 1 h after infection and monitored the days p.i. as shown. For all images shown, the color scale ranges from blue (just above background with a minimum set to 15,000 photons/sec/cm2/sr) to red (maximum of 1 × 10⁶ photons/sec/cm2/sr). (B) The course of whole-body parasite burden expressed in terms of the photonic signal resulting from infection of A/J mice with either 106, 105 or 104 luminescent or 106 wild-type T. cruzi trypomastigotes. The total light emission from the entire mouse body was measured and data points were generated from the analysis of at least two mice per infection condition. Day 0 p.i. corresponds to measurements acquired 1 h p.i. (see A). The signal shown for wild-type infection corresponds to background noise of the IVIS instrument. Abbreviation: min, minimum.


