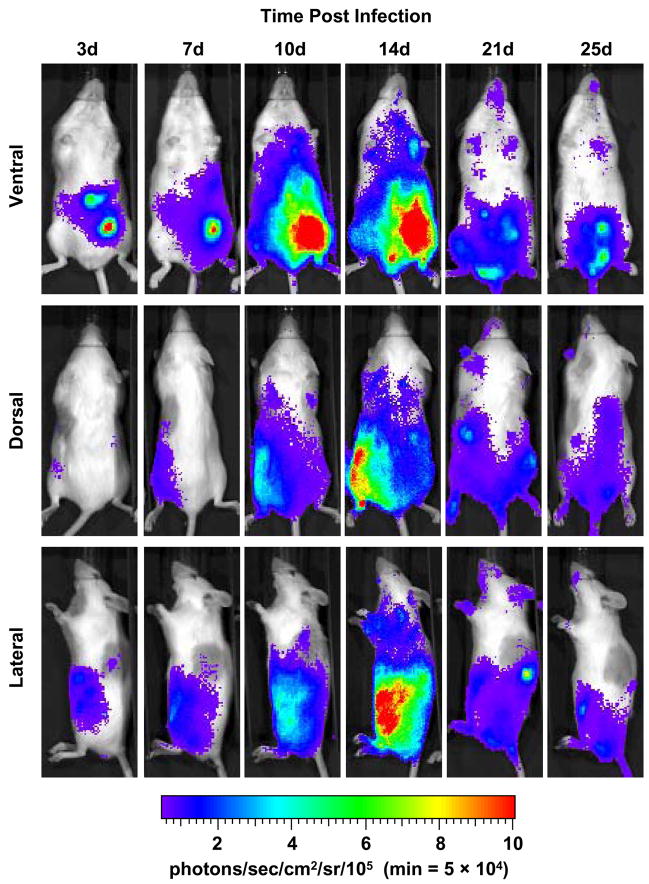
Fig. 3.
Course of parasite dissemination in a mouse model of experimental Chagas heart disease. A/J mice were injected i.p. with 1 × 10⁴ luminescent Trypanosoma cruzi trypomastigotes and imaged either ventrally, dorsally or laterally over the course of infection prior to death typically observed by 30 days p.i.. For all images shown, the color scale ranges from blue (just above background with a minimum set to 50,000 photons/sec/cm2/sr) to red (maximum of 1 × 10⁶ photons/sec/cm2/sr). The minimum for this scale was adjusted to avoid signal saturation during the peak of signal intensity. The ventral, dorsal and lateral perspectives for each timepoint were taken from the same animal and all images are representative of at least two animals. Abbreviation: min, minimum.

