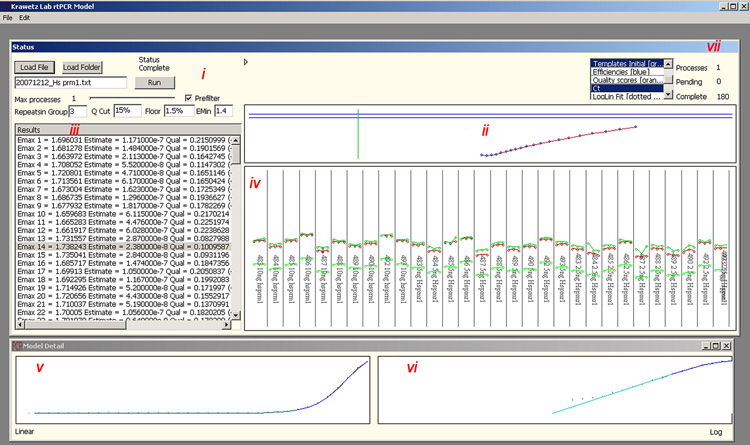
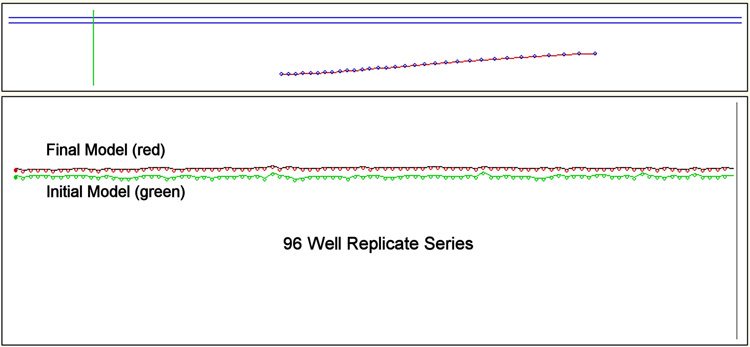
Figure 2.
The user interface of KLAB-PCR. The window driven interface includes (i) data loading and analysis preferences (ii) E(max) identification through the first non-linear model (iii) data output including Emax, template estimation and model quality (iv) a graphical representation of template estimates from the first model (top green) final model (middle red) and Ct approaches (lower green) (v) PCR amplification curve (blue) generated from the final model and data curve (red) (vi) Log-linear fit (blue) to data (red) (vii) Progress of analysis. Replicates may be grouped based on sets of primers (A) or treated as a single group for example where the same reaction is replicated across 96 wells (B).


