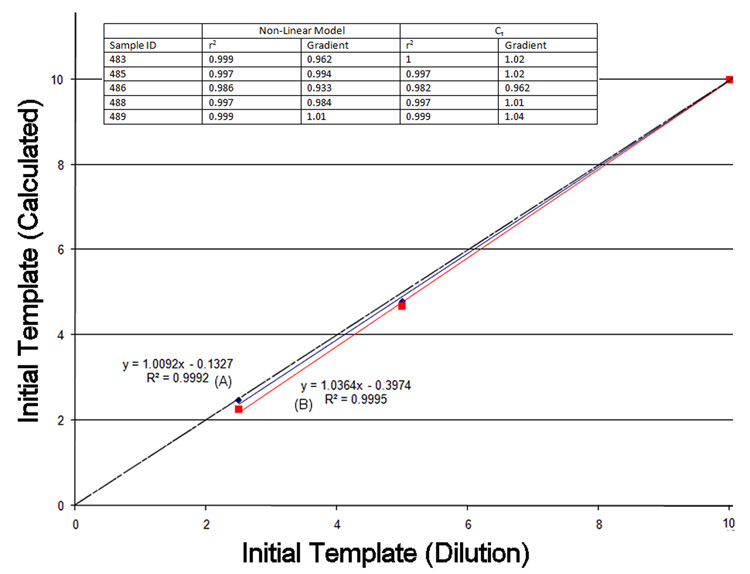
Figure 4.
Genomic template concentration calculated using the known dilution (X) and also by the two approaches described (Y). Initial template (Protamine 1, primers Table 1) (10 units) was serially diluted by a factor of 2 and 4 and reactions undertaken on a Chromo4 thermocycler. The non-linear model (A, blue) and Ct model (B, red) both closely parallel each other in this reaction due to the near perfect reaction efficiency. The r2 and gradients for five different biological samples are also shown (inset table). Ideal values for the gradients and r2 values are 1 as indicated by the dotted line in the chart.

