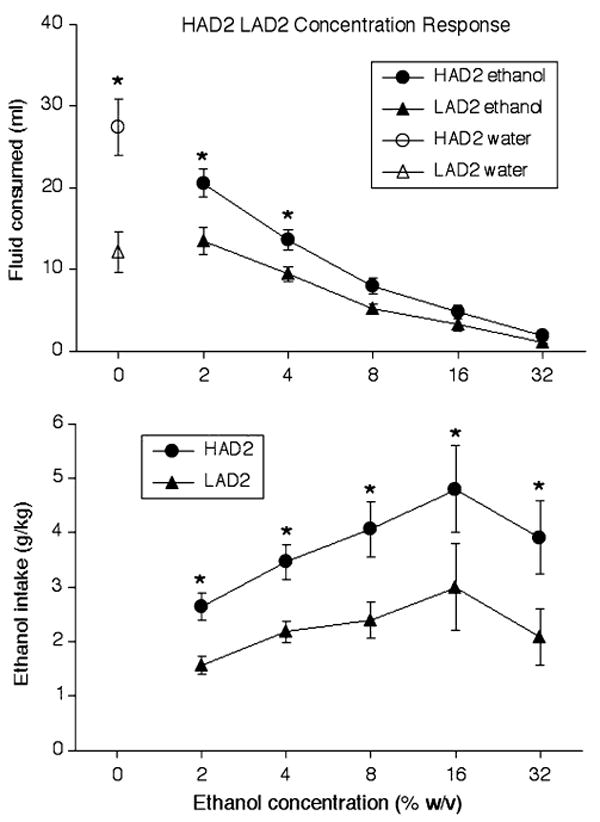
Fig. 3.

(Upper panel) Mean (±SEM) consumption of water (ml; open symbols) and solutions containing various ethanol concentrations (w/v; solid symbols) in HAD2 rats (circles) and LAD2 rats (triangles) across 8-day blocks of the ethanol concentration response phase during which a single fluid was available during test sessions. (Lower panel) Mean (±SEM) ethanol intake (g/kg) from solutions of various ethanol concentrations (w/v) by HAD2 rats (circles) and LAD2 rats (triangles) across 8-day blocks of the ethanol concentration response phase during which a single fluid was available during test sessions. * P < 0.05 significant difference from LAD2 rats
