Fig. 5.

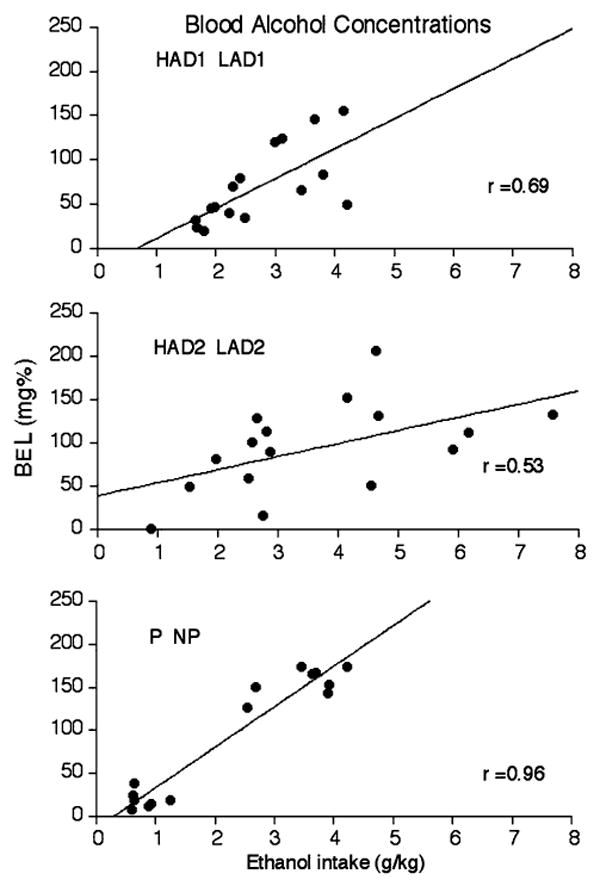
Scatter plots of ethanol intake (g/kg) and blood-ethanol levels (mg%) by individual rats of the P/NP, HAD/LAD1, and HAD2/LAD2 pairs of lines on criterion day of the 8% (w/v) ethanol reintroduction phase

Scatter plots of ethanol intake (g/kg) and blood-ethanol levels (mg%) by individual rats of the P/NP, HAD/LAD1, and HAD2/LAD2 pairs of lines on criterion day of the 8% (w/v) ethanol reintroduction phase