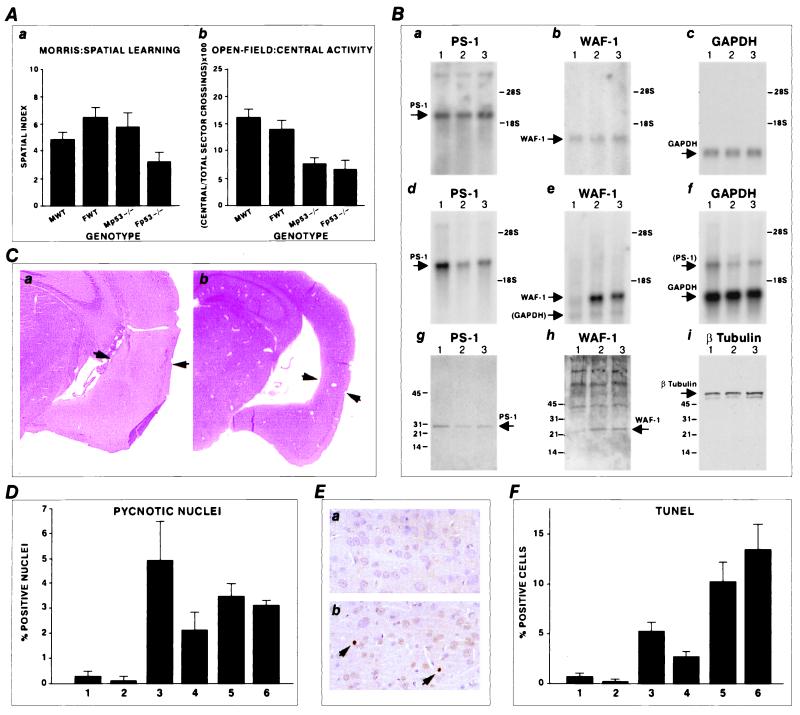
Figure 2.
Memory and behavioral alterations with apoptosis and deregulation of PS1 in p53 knockout mice. (A) Morris swim maze test. (a) Dropped into the water, mice had to learn to navigate to the invisible platform. After the end of the learning sessions, mice were submitted to a probe test for the spatial bias. F, female; M, male; WT, wild type. The two-way ANOVA revealed a significant genotypic X sex interaction [F(1,43) = 11.63; P = 0.001; r2 = 0.26]. Scheffé post hoc test: Fp53−/− versus FWT = 3.25; P = 0.01; Fp53−/− versus Mp53−/− = 2.77; P = 0.043. p53−/− females show significantly inferior performance. (b) Open field test. Behavioral measurements were done during the first 5 min after the introduction of each mouse in the open field. The relative central activity was the number of central sector crossings expressed as the percentage of the total sector crossings. ANOVA for relative central activity: F(1,43) = 44.93; P < 0.001; r2 = 0.52. p53−/− mice have a significantly lower percentage of relative central activity. (B) Northern blot analysis (a–f) of PS1, p21waf1, and GAPDH in the brains of young (a–c) and adult (d–f) mice. (Lane 1) Control mouse. (Lanes 2 and 3) p53 knockout female and male. a–c show the same Northern blot hybridized with the different probes. For the adult mice, hybridization was also performed on the same (d–f) Northern blot. The parentheses around GAPDH and PS1 indicate the residual signals after probe stripping in nonstringent conditions. A strong repression of PS1 (d) and induction of p21waf1 (e) are noticed in the adult p53-deficient mice. Western blot analysis of protein extracts from the brains (g–i) of the same adult animals with anti-PS1, anti-p21waf1, and anti-β-tubulin antibodies. (Lane 1) Control mice. (Lanes 2 and 3) p53 knockout animals. Increased p21waf1 and decreased PS1 expression is seen in the p53-deficient mice. (C) Hematoxylin and eosin stain of the isocortex in a control (a) and a knockout mouse (b). Note the thinning of the isocortex (arrows) in the knockout mouse (b). Original magnification = ×6.6. (D) Quantification of pyknotic nuclei in control mice (bar 1, male; bar 2, female) and p53 knockout mice (bars 3 and 4, males; bars 5 and 6, females). (E) TUNEL and counterstaining by Harris hematoxylin in control (a) and knockout mouse (b). Two nuclei are TUNEL-positive (arrows). Original magnification = ×132. (F) Quantification of the TUNEL assay in control mice (bar 1, male; bar 2, female) and p53 knockout mice (bars 3 and 4, males; bars 5 and 6, females).

