Figure 1.
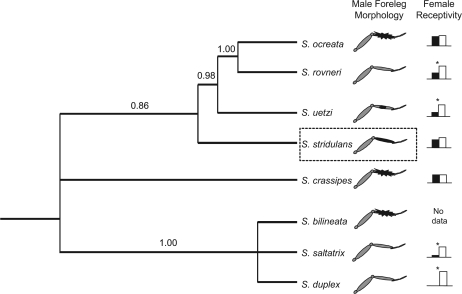
Stylized phylogenetic tree of Schizocosa species based on a Bayesian analysis (general time reversible [GTR] + G model) using data from Hebets and Vink (2007) and sequences of Schizocosa crassipes. Schizocosa ocreata and Schizocosa rovneri are shown as distinct species in this figure; however, this was not supported by the molecular data (see Hebets and Vink 2007). Male foreleg ornamentation is indicated next to each taxon. The graphs next to each foreleg represent the proportion of females that were receptive to isolated courtship signals in prior signal isolation experiments. The y axis is “proportion of females receptive,” and the black bars show female receptivity to visual-only signals, whereas the white bars show female receptivity to seismic-only signals. Asterisk above the graph indicate significant differences in female receptivity to visual-only versus seismic-only stimuli (P < 0.05). Data are compiled from the following sources: (Scheffer et al. 1996; Hebets and Uetz 1999; Uetz and Roberts 2002). The dashed box around Schizocosa stridulans highlights the species used in the present study.

