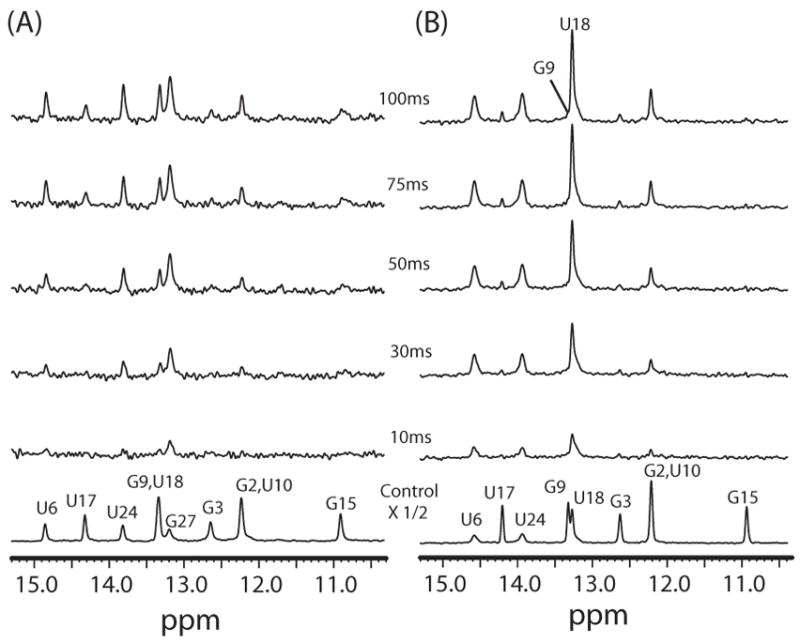
Figure 3.

Imino proton difference spectra between control spectra (shown on bottom) and spectra acquired by varying the delay time after water inversion for the HBD-Macugen complex at (A) 15 °C and (B) 35 °C. The control spectra are the watergate solvent suppression experiment except that no water inversion was performed.
