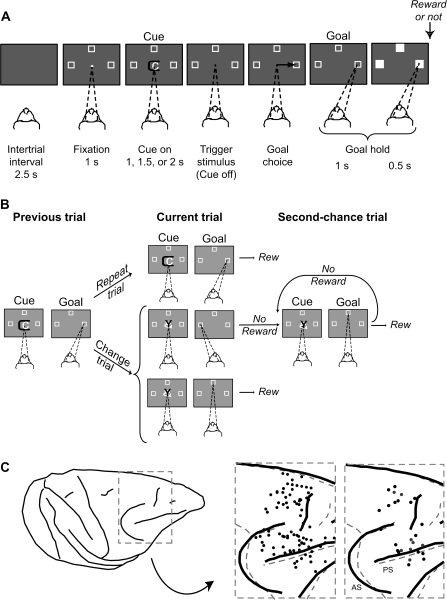
Figure 1.
Task design and recording locations. (A) Sequence of task events. Each gray rectangle represents the video screen. On the screen, a central white circle (fixation point) and 3 white squares (potential goals) appeared on each trial. The dashed lines show the monkey's gaze angle and fixation target. Next, the cue appeared, and its offset triggered a saccade (black arrow)—to the right goal, in this example. (B) Previous, current, and 2nd-chance trials. On each current trial, a visual cue was selected pseudorandomly from a set of 3 cues. If the cue had repeated from the previous trial (called repeat trials), then staying with the most recent goal (the right one, in this example) produced a reward on the current trial. If the cue had changed (change trials), then the previous goal should be rejected in favor of 1 of the 2 alternatives, but the choice of only 1 of these (the top one, in this example) produced a reward. Rewarded choices ended a trial, but unrewarded choices led to 2nd-chance trials until a reward was obtained. Rew, reward. (C) Penetration sites: composite from both monkeys, relative to sulcal landmarks. Left to right: Drawing of 1 monkey's brain with the inset marked by a dashed gray box. The 1st inset (from left to right) shows the penetration sites for the overall population (black circles). The dashed gray sulcal lines show the alignment with the 2nd monkey. The 2nd inset shows the penetration sites for the pairs studied here (monkey 1, black circles; monkey 2, gray circles). AS, arcuate sulcus; PS, principal sulcus.

