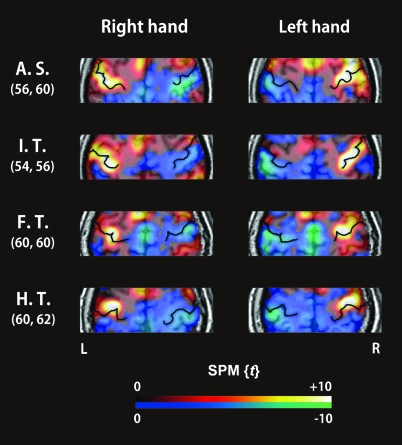
Figure 1.
Representative SPM{t} values from around the CS during finger movements (main effect of hand movement) for all frequencies superimposed on the individual's high-resolution MRI data. In the color scale, red to yellow represent positive t-values (an increase in the BOLD signal), whereas blue to green represent negative t-values (a decrease in the BOLD signal). The enhanced black lines on the activation maps represent the CS. The numbers on the left indicate the z coordinates of the 2 axial slices (mm), which represent the distance from the transaxial plane including the anterior commissure–posterior commissure (AC–PC) line.

