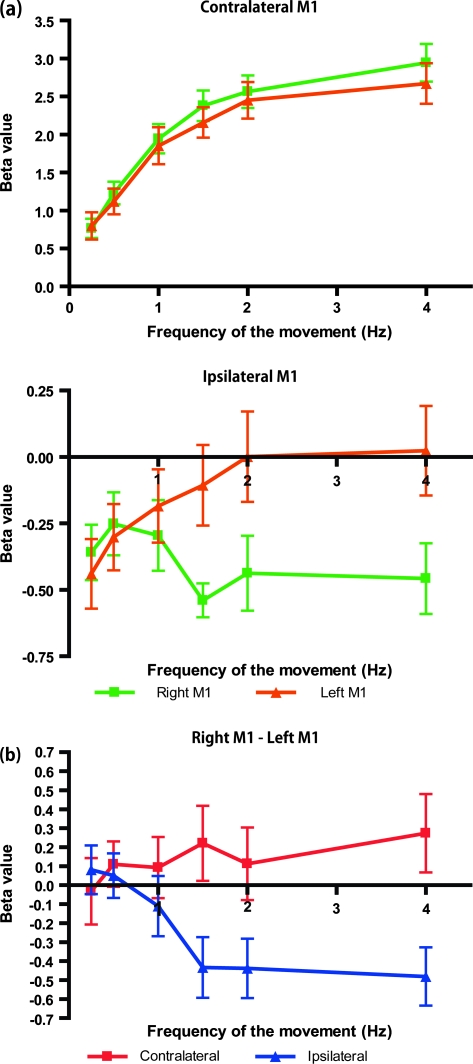
Figure 3.
Average beta values for each frequency condition. (a) The beta values measured at the right (green) and left (orange) M1 areas, contralateral (top) and ipsilateral (bottom) to the task hand. (b) Subtraction of the beta values (right M1 − left M1) for the contralateral and ipsilateral M1 areas shown in (a). The ipsilateral M1 showed an asymmetric activity pattern, whereas that of the contralateral M1 was symmetric. All data represent the mean ± SEM.

