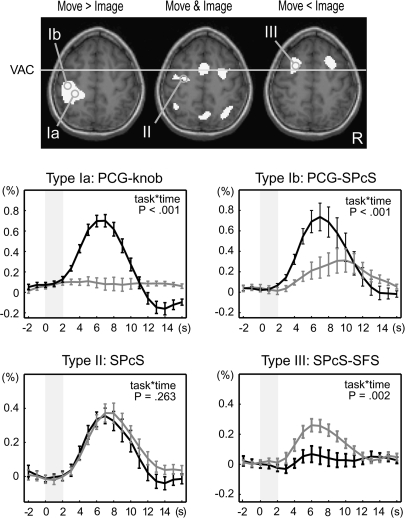
Figure 2.
Classification of cue stimulus–related activity for time-course analysis. Cue stimulus–related activity was classified into 3 types: type I showing movement-predominant activity, type II showing cue stimulus–related activity similarly for movement and imagery events, and type III showing imagery-predominant activity. Activation maps from a representative subject (P < 0.001, uncorrected) were overlain onto an axial slice (z = 56 mm) of the individual's own anatomical image. Gray circles are examples of the sampled VOIs including the “hand knob” of the precentral gyrus (PCG-knob, Ia), rostrolateral part of the PCG juxtaposed to the superior precentral sulcus (PCG-SPcS, Ib), SPcS (SPcS, II), and SPcS extending into a posterior part of the superior frontal sulcus (SPcS-SFS, III). Time-course data were sampled from predetermined sets of areas according to each individual's anatomy and activation maps as such. Signal changes from VOIs were aligned to the cue stimulus onset (time 0), converted into percent signal changes, and averaged across subjects. Type I activity was further divided into 2 subtypes: type Ia (e.g., PCG-knob) showing clear movement-related activity (black) with almost no imagery-related activity (gray) and type Ib (e.g., PCG-SPcS) showing salient movement-related activity with modest (ca. 0.3%) imagery-related activity. Activity in the SPcS (type II) and the SPcS-SFS (type III) is shown in the same format. P values indicate task-by-time interaction by repeated-measures ANOVA, and the error bars indicate standard errors of mean. The x-axis represents time in seconds after the cue stimulus onset, and the y-axis represent percent signal changes. Gray shades indicate the period of time during which the cue stimuli were presented.

