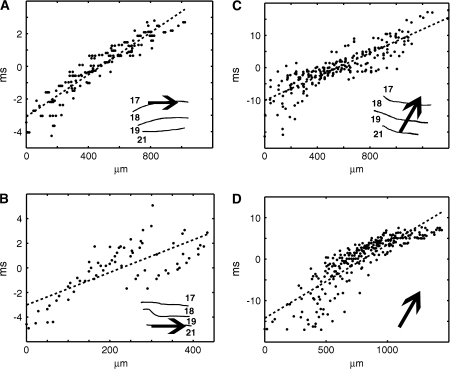
Figure 6.
Examples of the wave-fronts and motion feedback during AM. The examples show the regression on the point clouds obtained from each point of the cortex along the paths taken by the wave-fronts in the direction found by the wave-front algorithm (Fig. 3). (A) The 1st motion of the 17/18 wave-front, in experiment 1, 31–40 ms after the offset of the lower square. The abscissa shows the distance form the retinotopic site of the lower square. The ordinate shows the time in ms centered as in Figure 3. The arrow shows the direction found by the algorithm (data d(ΔV(t))/dt; Animal 60). Estimated mean velocity 0.21 mm/ms. (B) The motion of the 19/21 wave-front 31–43 ms after the offset of the central square (data d(ΔV(t))/dt; Animal 98). Abscissa distance from center square retinotopic site. (C) motion feedback in the time interval 22–62 ms after the offset of the lower square in experiment 1 (data: ΔV(t); Animal 98). Abscissa: distance from the retinotopic site in area 19/21. (D) Motion feedback in experiment 3, 31–56 ms after offset of lower square (data: ΔV(t); Animal 116). Abscissa: distance from the retinotopic site in area 19/21.

