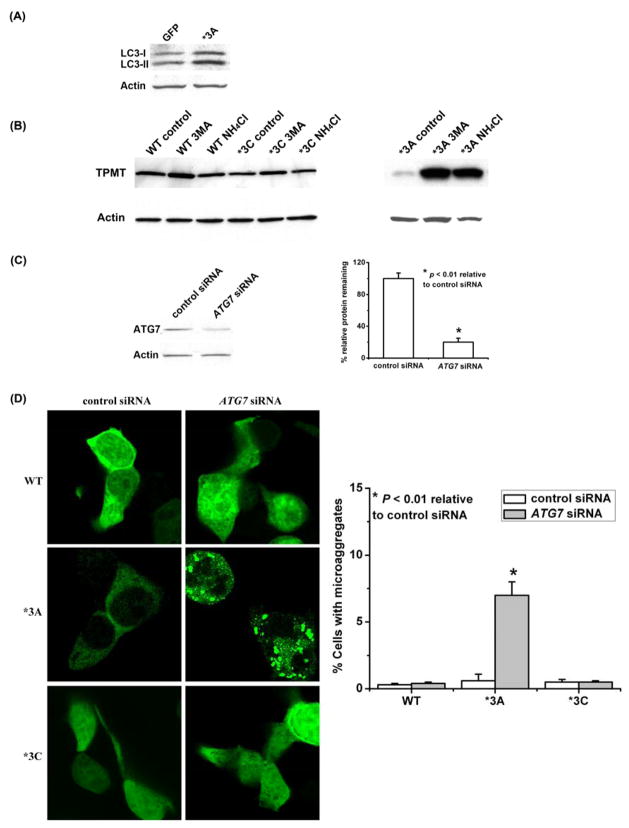
Figure 5.
Autophagy and TPMT WT, TPMT*3A and TPMT*3C degradation and aggregation. (A) Immunoblot analysis of LC3 in HEK293 cells expressing GFP or TPMT*3A. (B) HA-tagged WT TPMT, TPMT*3A and TPMT*3C were transiently expressed in HEK293 cells. The cells were treated with 10 mM 3-methyladenosine (an autophagy inhibitor), 50 mM NH4Cl (a lyosomal inhibitor) or water for 48 h. TPMT allozymes were detected with an anti-HA antibody. The blot on the left did not include TPMT*3A without inhibition of autophagy, while the blot on the right did. (C) Immunoblot analysis of ATG7 in HEK293 cells transiently transfected with ATG7-specific siRNA treatment. The bar graph shows quantification of the Western blot densities (N = 3). (D) Enhanced TPMT*3A aggregation in HEK293 cells after ATG7-specific siRNA treatment. HEK293 cells expressing HA-tagged WT TPMT, TPMT*3A or TPMT*3C were transfected with control siRNA or siRNA directed against ATG7 and were stained with anti-HA antibody. Aggregates were visualized with confocal epifluorescence microscopy. A total of 200 cells were counted in each experiment. The bar graph shows microaggregate formation for cells transfected with WT TPMT, TPMT*3A and TPMT*3C after ATG7 knockdown (N = 3).

