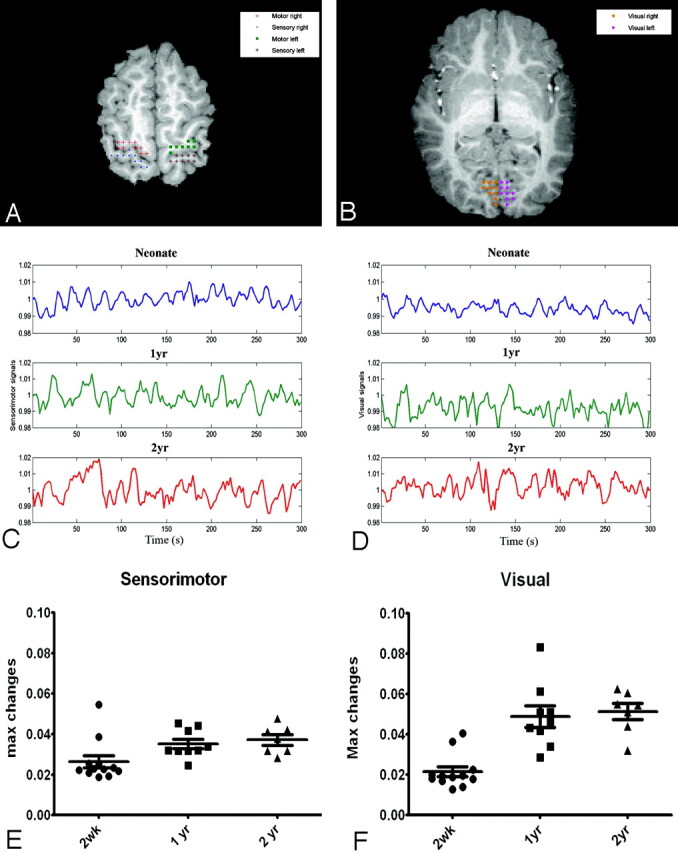
Fig 1.

A and B, The anatomic locations for defining the sensorimotor and visual areas are shown, respectively. The crosses, filled circles, squares, asterisks, left triangles, and right triangles represent the right motor, right sensory, left motor, left sensory, left visual, and right visual cortices, respectively. C and D, Representative processed MR signals at the sensorimotor and visual areas by using the approaches outlined in the “Materials and Methods” section for a neonate (upper row) and 1- (middle row) and 2-year-old (bottom row) children are shown, respectively. E and F, The percent signal intensity difference between the maximum and minimum signals for the sensorimotor and visual areas are shown for each age group. The error bars represent the SDs. max indicates maximum; s, second; wk, week; yr, year.
