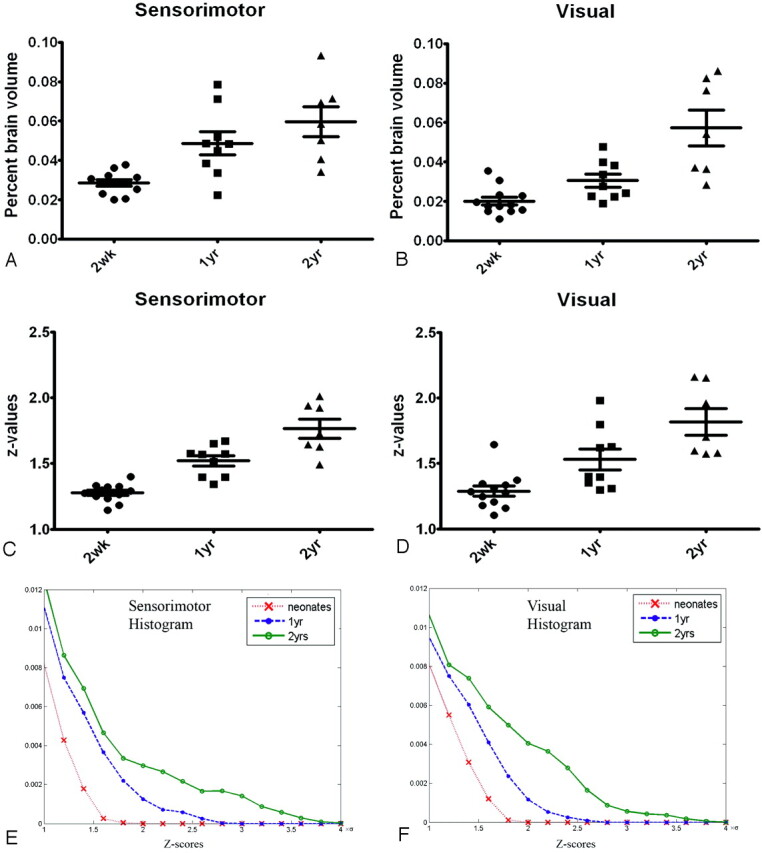
Fig 4.

Quantitative comparisons of the percent brain volume exhibiting rfc (A and B) and the z-score values (C and D) and histograms (E and F) for the 3 age groups at both the sensorimotor and visual areas are shown. A–D, The error bars represent the SDs. E and F, The y-axes represent the normalized populations. yr indicates year; wk, week.
