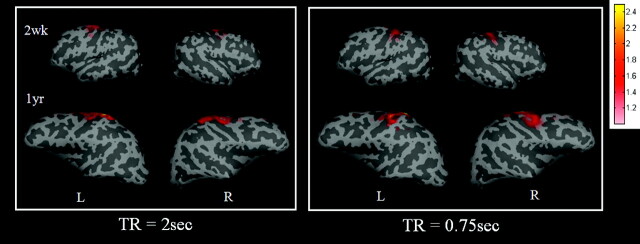
Fig 5.
A comparison of 2 different TRs for obtaining rfc at the sensorimotor area is shown. The left and right sensorimotor regions of interest are used to obtain the reference functions for correlation analysis for both TRs. The color bar represents the z-score values. L indicates left hemisphere; R, right hemisphere; wk, week; yr, year.

