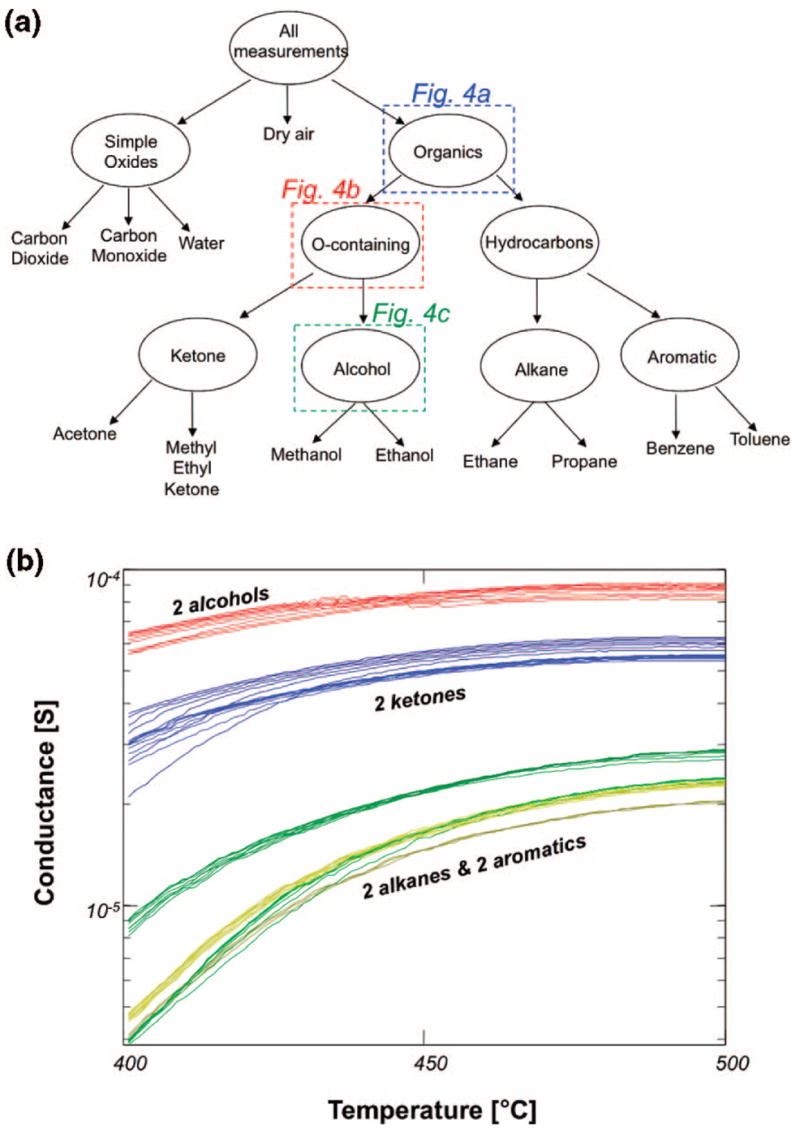
Figure 3.

Divide-and-conquer approach to classification of the training data. (a) The hierarchy used to categorize the analytes present in the training data. (b) A region of raw data from sensor 1 with a similar conductance vs temperature profile for all four alkanes and aromatics, a separate profile for both ketones, and a third profile for both alcohols. Line color represents the analyte present during measurement, using the same color code as in Figure 2a. Though difficult to distinguish, between 7 and 10 overlapping lines of each color are plotted, representing repeated measurements. The presented data represent less than 2% of the overall microarray data set.
