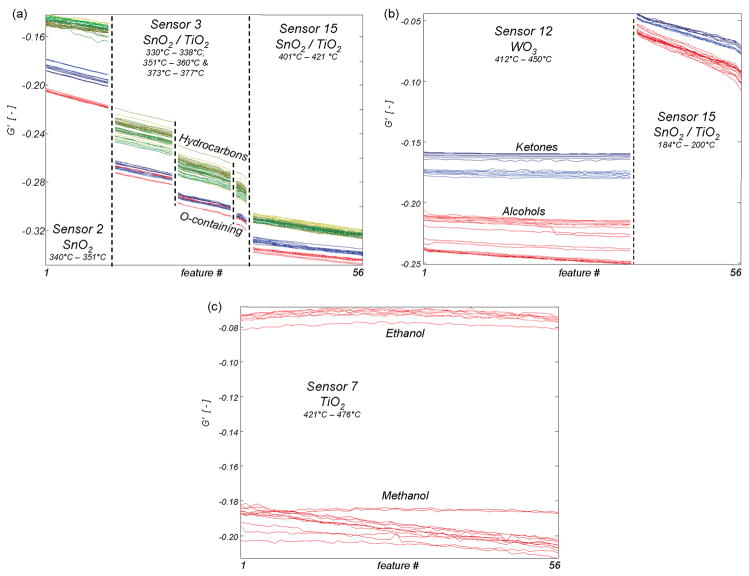
Figure 4.
Drift-corrected raw data used for various categorization tasks. For each task, the data represent the 1% of data points with maximal t-statistic. Line color represents the analyte present during measurement, using the same color code as in Figure 2a. (a) Categorization of organics into those that do or do not contain oxygen. For simplicity, only data collected at 3 μmol/mol analyte concentrations are shown. (b) Categorization of oxygen-containing organics into alcohols or ketones. (c) Categorization of alcohols into methanol or ethanol.

