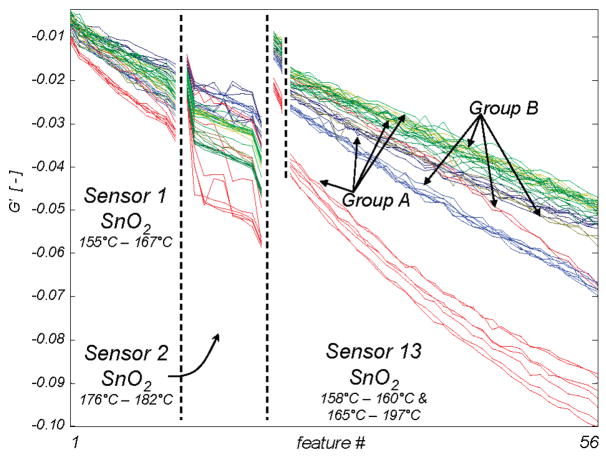
Figure 8.
The 1% of drift corrected raw data points with maximal t-statistic for categorization of the organics into group A (ethanol, acetone, propane, toluene) or B (methanol, methyl ethyl ketone, ethane, benzene). Line color represents the analyte present during measurement, using the same color code as in Figure 2a.

