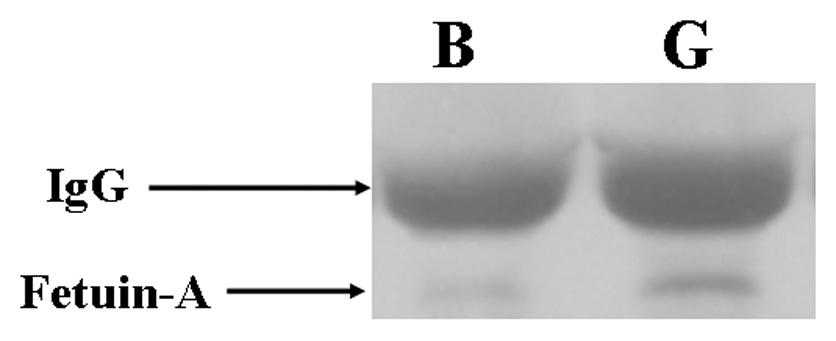
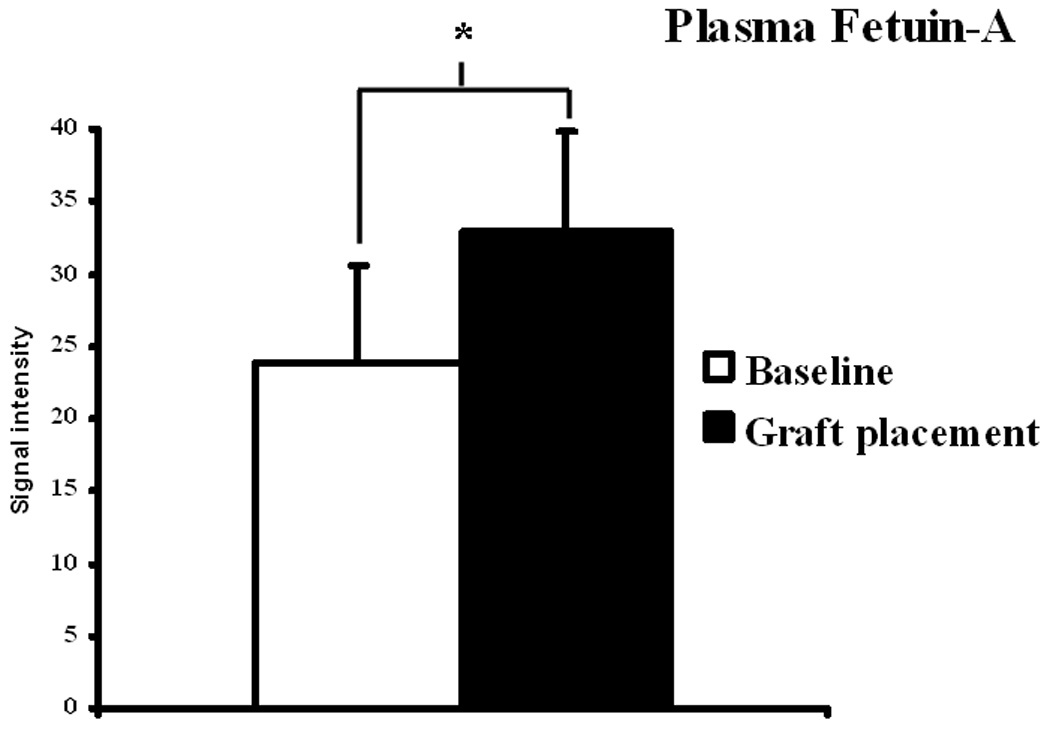
Figure 4.


Immunoprecipitation followed by Western blot analysis of fetuin-A in serum at baseline (prior to renal artery embolization) and at graft placement. A is representative blots of fetuin-A in plasma prior to (baseline) renal artery embolization and at PTFE graft placement and controls with IgG loading. B shows pooled data for the fetuin-A. In plasma, there was significant increase in expression of fetuin-A (*) was significantly higher than the baseline plasma value (P<0.05). Data are presented as mean ± SD.
