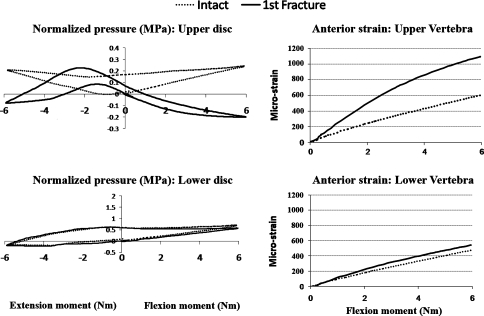
Fig. 4.
Graphs showing the changes in the disc pressure (MPa) and anterior wall strain of the adjacent VBs (microstrain) after the selective damage to the upper endplate of the specimen shown in Figs. 2, 3. Data were collected during flexion-extension runs, under 400 N preload. Pressure and strain values were normalized so that values in neutral position under 400 N preload were taken to zero

