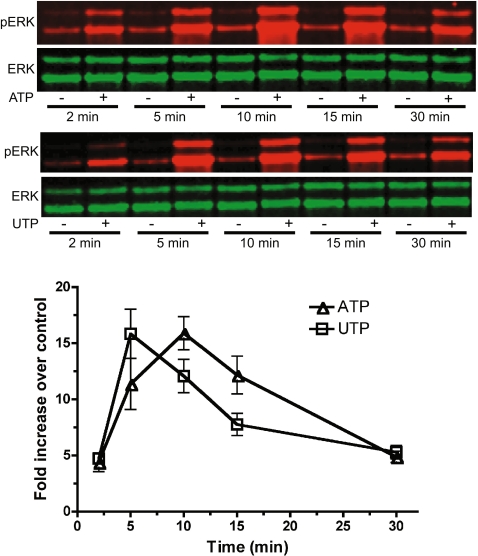
Fig. 1.
Nucleotide-stimulated ERK1/2 phosphorylation is time dependent. BACCs were treated with ATP (100 μM) or UTP (100 μM) for 2 to 30 min. Blots are representative of three independent experiments performed in triplicate (n = 3); the upper band (phosphorylated or nonphosphorylated) is ERK1 = 44 kDa, and the lower band is ERK2 = 42 kDa. Blot intensities were measured with the Odyssey Imaging System; values are phosphorylated ERK2 intensity divided by total ERK2 intensity. Points on the graph represent mean ± standard error of the mean

