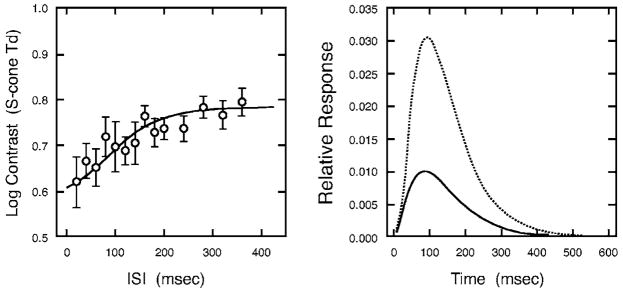
Fig. 2.
Left panel shows contrast threshold in S-cone trolands as a function of ISI for an older observer (78.3 years). Threshold data were double pulses separated by varying ISIs. Error bars denote ±1 SEM (standard error of the means). The solid curve in the right panel illustrates the impulse-response function fitted to the threshold data. The dotted curve denotes the responses based on the sum of 3 successive frames. The summed curve was used for model fitting. The solid curve shows the calculated impulse-response function for a single frame.

