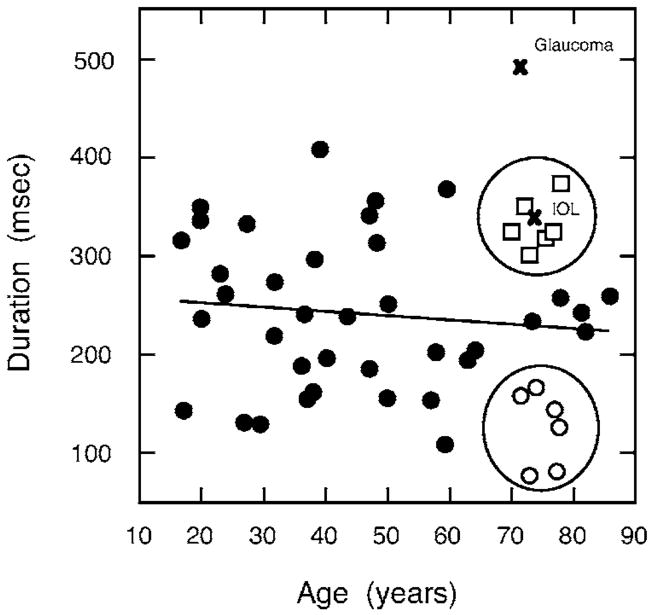
Fig. 5.
Duration of the S-cone impulse response (defined by 5% of the peak) as a function of age. The solid line denotes the least-squares linear regression for all observers except the two denoted by the × (IOL and glaucoma patient). Open circles and squares denote older observers with shorter and longer IRF durations, respectively.

