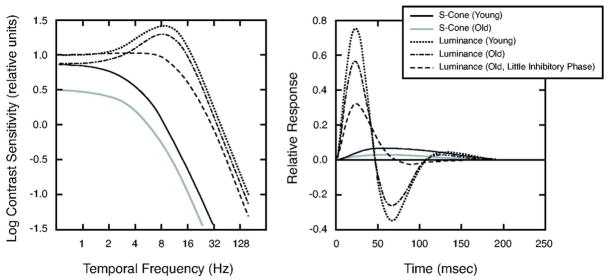
Fig. 9.
Left panel shows contrast sensitivity as a function of temporal frequency for an S-cone pathway of theoretical 20-year-old (black curve) and 80-year-old (gray curve) observers. The same panel shows tCSFs measured with luminance modulation (from Ref. 2): dotted, dotted–dashed, and dashed curves denote the tCSF for theoretical 20-year old and 80 year-old observers with normal and little secondary (inhibitory) phase, respectively. Right panel shows the theoretical IRFs used to generate these tCSFs calculated from the model equation. Curves are plotted as in the left panel.

