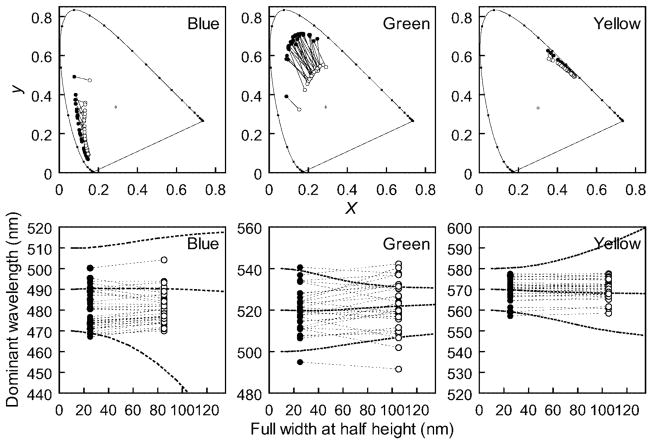
Figure 5.
Stimuli selected by individual observers for unique blue, green, and yellow for foveally viewed stimuli. Top panels plot the chromaticities in the CIE diagram. Bottom panels instead plot the stimuli according to the selected center wavelength. Solid and open symbols indicate narrowband and broadband settings, respectively. Dashed lines show settings predicted if no compensation occurs for the bandwidth change, based on the standard observer.

