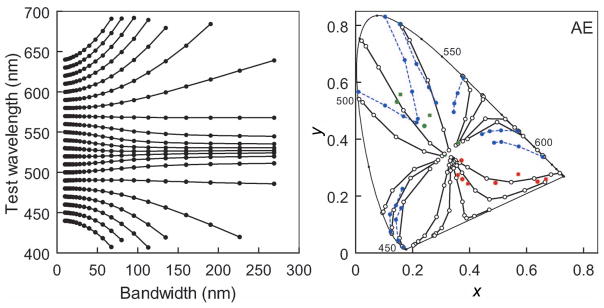
Figure 7.
(Left) Constant hue loci as a function of bandwidth for the standard observer, assuming no compensation for spectral screening. Complete compensation instead predicts straight lines of constant center wavelength. (Right) Corresponding predictions for the Abney effect, shown in the CIE diagram for comparison with observed measurements. In this case, the stimulus is desaturated by mixing a monochromatic light with an equal-energy white. This produces straight hue lines for a linear model, whereas the curved contours shown are predicted if the visual system instead applies a correction for the purity change that would be appropriate if the desaturated chromaticity resulted from a change in spectral bandwidth. For the extraspectral reds, the predictions were instead generated for inverse Gaussian spectra [with increasing purity modeled by subtracting from a flat spectrum a Gaussian of fixed bandwidth (100 nm) but increasing height]. Solid lines, unfilled symbols: predicted constant hue loci; dotted blue lines, blue symbols: observed constant hue loci replotted from Burns et al. (1984) for one participant (AE); unconnected red and green squares: observed unique red and green settings for the same observer.

