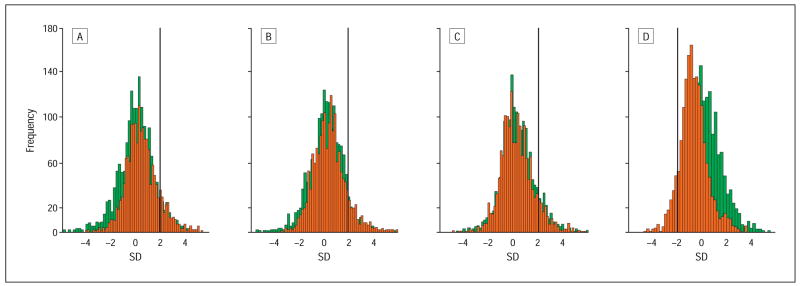
Figure 2.
Comparison of the localized multifocal electroretinogram responses with the normal control group at baseline (green) and at the follow-up visit (red) plotted in histograms. Numbers of multifocal electroretinograms are plotted as a function of standard deviations (SDs) from normal control data. Bold lines mark the point of significantly abnormal data (>2 SD for implicit times, <2 SD for response density). Significant changes were found for N1 and P1 implicit times and P1-N1 response density. A, N1 implicit time. Baseline, 8.1% had abnormal response; follow-up visit, 12.7%. B, P1 implicit time. Baseline, 7.9% had abnormal response; follow-up visit, 11.0%. C, N2 implicit time. Baseline, 10.8% had abnormal response; follow-up visit, 10.2%. D, P1-N1 response density. Baseline, 2.4% had abnormal response; follow-up visit, 10.8%.

