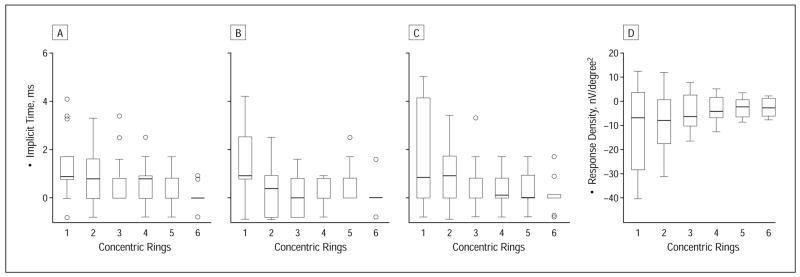
Figure 3.
Follow-up-baseline differences in implicit times N1 (A), P1 (B), and N2 (C) and response density P1-N1 (D) plotted for 6 different retinal eccentricities (labeled as concentric rings: ring 1, 1°; ring 2, 2°–5°; ring 3, 6°–10°; ring 4, 11°–15°; ring 5,16°–20°; and ring 6, 21°–25° radius retinal eccentricity). Boxes enclose 50% of the data with the median value displayed as a line; the top and bottom of the boxes mark 25%; and the error bars denote the minimum and maximum values of the data set. Values outside the range are displayed as an individual point. Significant changes in N1 and P1 implicit times occurred in the central ring (see text).

