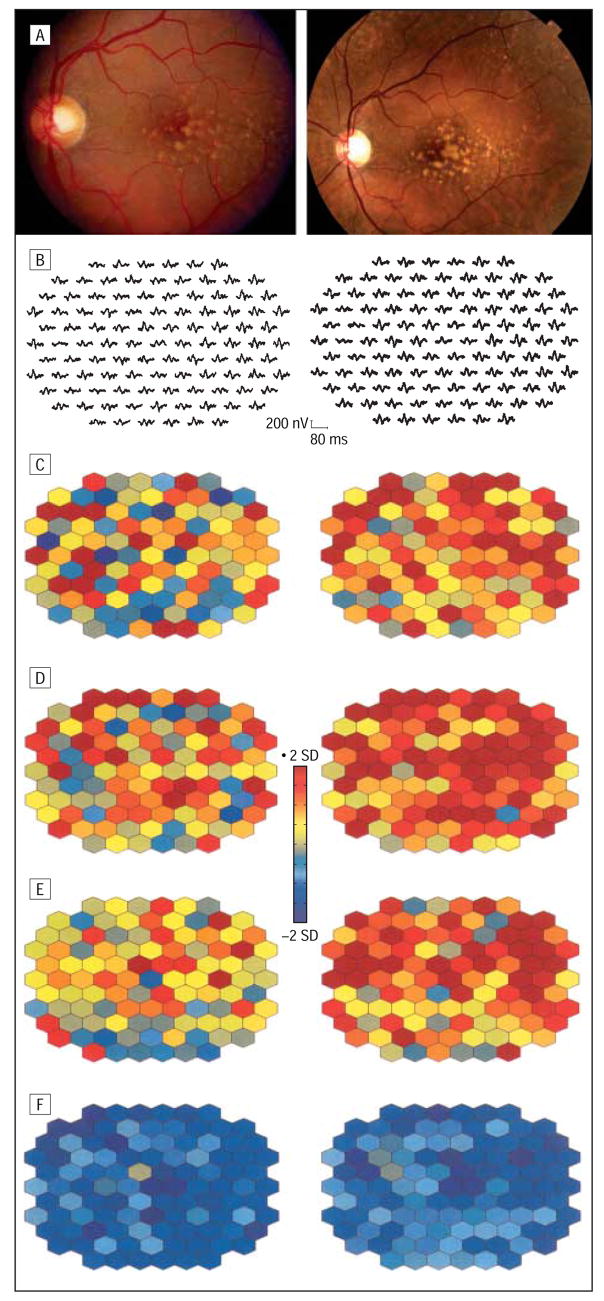
Figure 4.
Multifocal electroretinogram response alterations in an eye with drusen progression (patient 19, left eye). A, Color fundus photographs show an increased area of drusen after 40 months. Multifocal electroretinogram traces (B) and corresponding implicit time and response density parameters demonstrate a further progression in retinal function. Parameters are plotted in color-coded units of standard deviation (SD) from normal. Abnormal response densities are coded in dark blue (<2 SDs) and delayed implicit times of more than 2 SDs, in red. Images on the left side of the figure are baseline; images on the right side, at 40 months’ follow-up. C, N1 implicit time. D, P1 implicit time. E, N2 implicit time. F, P1-N1 response density.

