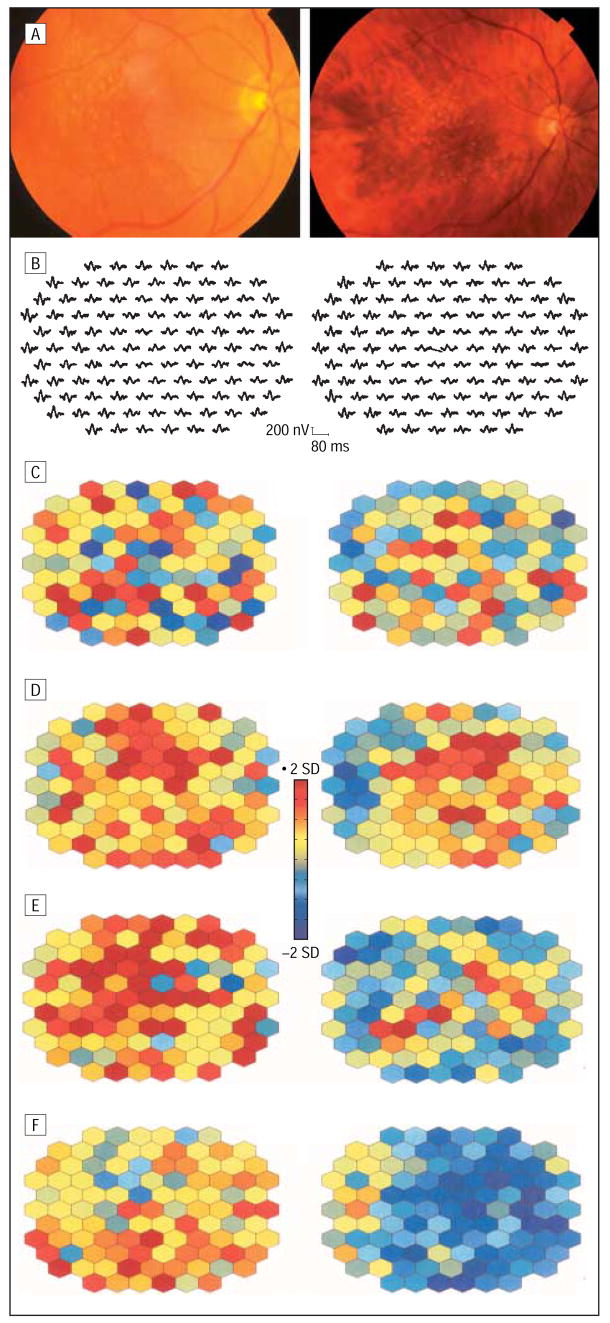
Figure 5.
Fundus photographs (A), multifocal electroretinogram traces (B), and analyzed multifocal electroretinogram parameters from the right eye of patient 13, with unchanged drusen after 28 months. Color-coded plots illustrate fewer areas with abnormal N2 implicit time but deterioration in response density. See Figure 4 for plot explanation. Images on the left side of the figure are baseline; images on the right side, at 28 months’ follow-up. C, N1 implicit time. D, P1 implicit time. E, N2 implicit time. F, P1-N1 response density.

