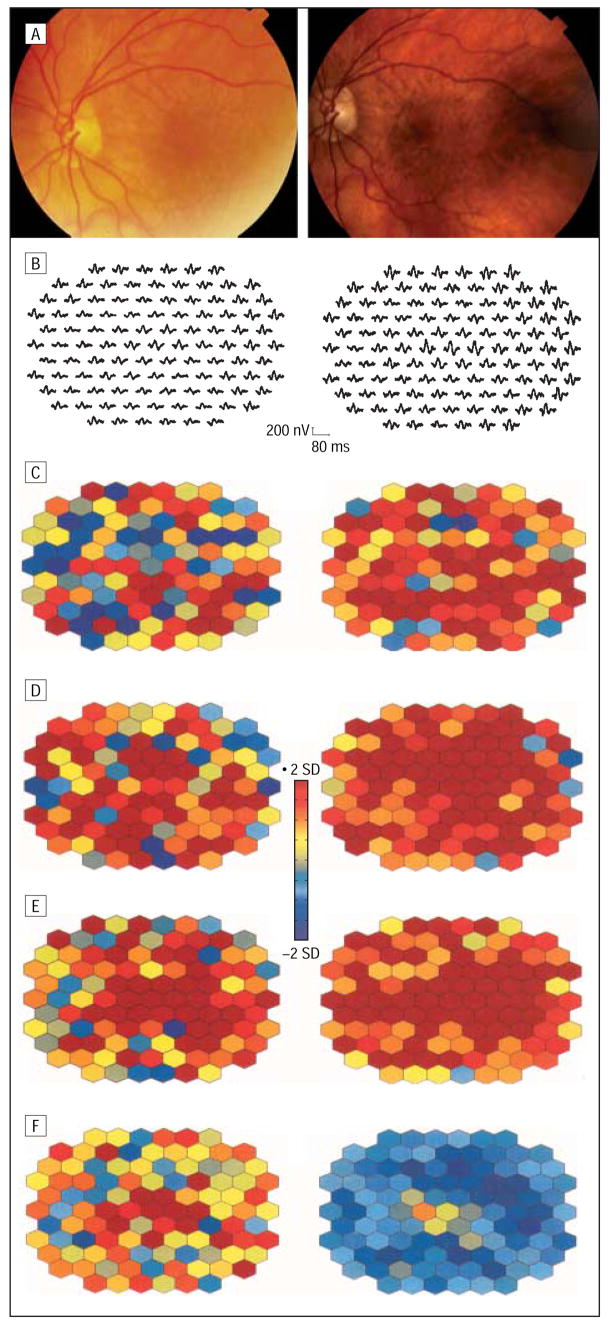
Figure 6.
Multifocal electroretinogram response progression in 1 eye with drusen regression associated with retinal pigment epithelium changes after 33 months. More retinal areas show response delays (color-coded as red) and response losses (blue) at the follow-up test compared with baseline. See text for explanation of different multifocal electroretinograms’ trace quality. Images on the left side of the figure are baseline; images on the right side, at 33 months’ follow-up. A, Fundus photographs. B, Multifocal electroretinogram trace. C, N1 implicit time. D, P1 implicit time. E, N2 implicit time. F, P1-N1 response density.

