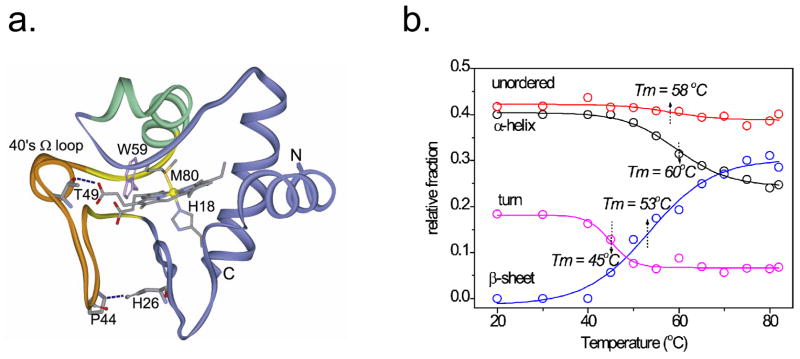
Figure 4.
a) Ribbon diagram for the cytochrome c structure. A short β-sheet flanking the 40s Ω loop (orange) is suggested to extend into the loop itself, when the H26…P44 H-bond is weakened at pH 3, accounting for the temperature-induced conversion of turn and helix content into β-sheet, b) Temperature profiles were obtained by least squares fitting of the UVRR amide regions to standard secondary structure spectra [16].

