
Figure 1.
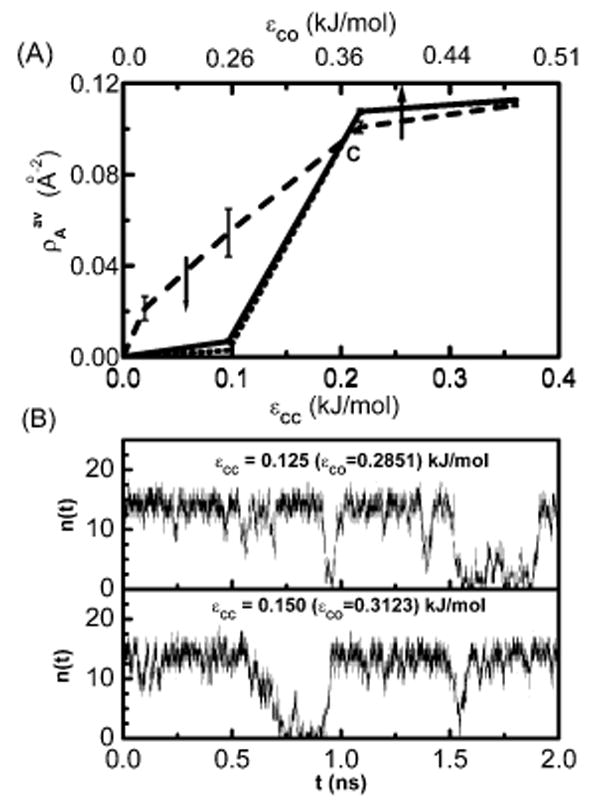
(A) Plot of the average number of water molecules per unit area of the solute plate as a function of ∊CC (bottom axis) or ∊CO (top axis) for three different solute sizes. The solute-I with two 28-atom plates is shown by a dashed line, the solute-II (60-atom plates) system is shown by a solid line and the solute-III (180-atom plates) system is shown by a dotted line. (B) Plot of the instantaneous number of confined water molecules n(t) between the two solute-II plates vs time in nanoseconds for two different attraction strengths of the solute atom.