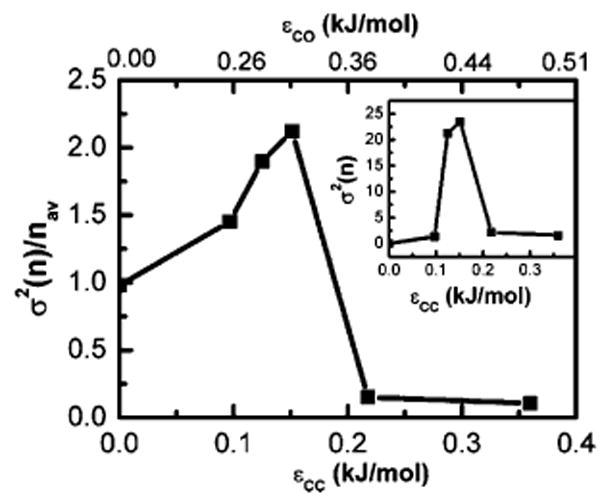
Figure 2.

Plot of the relative fluctuation in the number of confined water molecules between the two solutes σ2(n)/nav for the water–solute-II system as a function of the attractive strength of the solute (∊CC) (bottom axis) or the solute–solvent (∊CO) (top axis)
