
Figure 3.
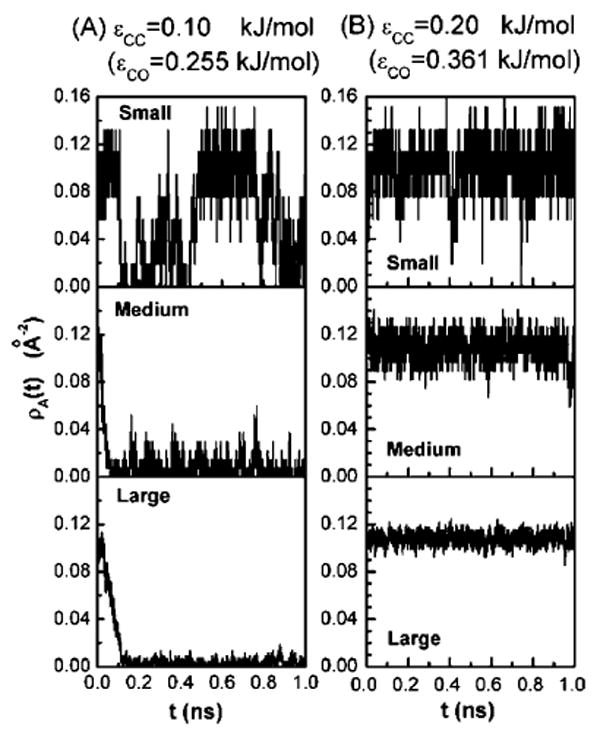
Plot of the instantaneous variation in water density ρA(t) in the intersolute region for three solute sizes with solute attraction strengths (A) ∊CC = 0.1 kJ/mol and (B) ∊CC = 0.2 kJ/mol.
Official websites use .gov
A
.gov website belongs to an official
government organization in the United States.
Secure .gov websites use HTTPS
A lock (
) or https:// means you've safely
connected to the .gov website. Share sensitive
information only on official, secure websites.
Plot of the instantaneous variation in water density ρA(t) in the intersolute region for three solute sizes with solute attraction strengths (A) ∊CC = 0.1 kJ/mol and (B) ∊CC = 0.2 kJ/mol.