
Fig. 2.
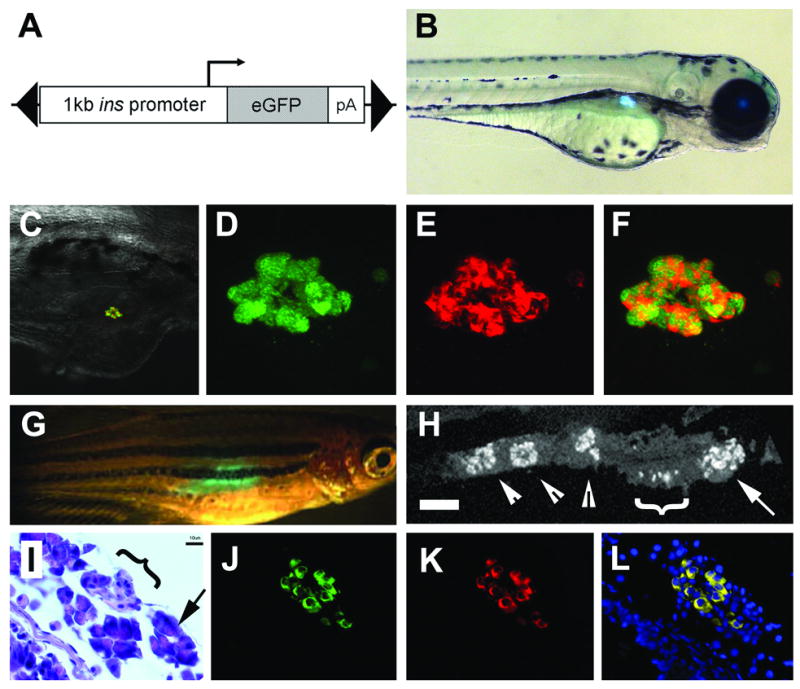
Insulin promoter reliably drives expression to the β cells. (A) Schematic of construct used including the 1kb promoter region of preproinsulin, and gene encoding eGFP, all within a Tol2 transposable element (black triangles). (B) Fluorescent image of a 3 day old ins:eGFP embryo showing expression within the islet of the pancreas. (C) Rendered composite of confocal images of a 10 day old ins:eGFP embryo following immunofluorescence to detect insulin, with overlaid 20x bright field. (D) Close up images of eGFP fluorescence and (E) immunofluorescence to detect Insulin and (F) merged image demonstrating co-localization of eGFP with Insulin. (G) 3 month ins-eGFP adult fish showing transcutaneous fluorescence. (H) Section through dissected pancreas showing immunofluorescence to detect Insulin (scale bar = 100μM). The principal islet can be seen in the anterior head of the pancreas (arrow). More posterior are small aggregatons of β cells (white bracket) and three secondary islets (arrowheads). (I) High magnification, the morphology of the smaller islets can be seen (black Targeted ablation of β cells bracket) surrounded by acinar tissue (arrow), by H&E staining (scale bar =10μM). Immunofluorescence detection for eGFP in (J), insulin in (K). (I) Merged image demonstrate co-localization in adult tissues (Hoescht staining for nuclei in blue). In (B to H) anterior is to the right and posterior to the left.