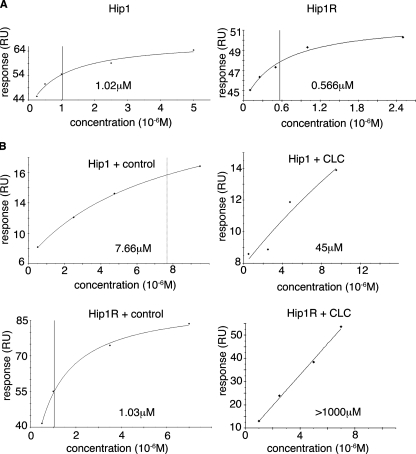
FIGURE 5.
SPR binding of Hip1 and Hip1R to clathrin light chain and actin. Representative SPR plots for steady state binding between Hip proteins and clathrin light chains or actin are shown. Fitted binding affinities are noted on each plot, with a vertical line also indicating fitted binding affinity. A, purified clathrin light b (LCb neuronal isoform) was immobilized on a CM5 chip by amine coupling. Purified coiled-coil domains of Hip1 or Hip1R at the concentrations indicated were flowed over the clathrin light chain surface until a steady state was reached, and the steady state response units (RU) were plotted. B, actin purified from rabbit muscle was assembled and immobilized on a CM5 chip by amine coupling. Purified Hip1 or Hip1R fragments containing the coiled-coil and THATCH domains (Hip1ccth or Hip1Rccth) were flowed over the F-actin surface at the concentrations indicated in the presence of saturating amounts (20 μm) of clathrin light chain peptide (CLC) or GroEL control peptide. All data were collected on a Biacore T100. BiaEvaluation software (Biacore) was used for steady state analysis of binding data. Curves with clathrin light chain peptide have no line indicating binding affinity, because fitted binding affinity was off the scale.

