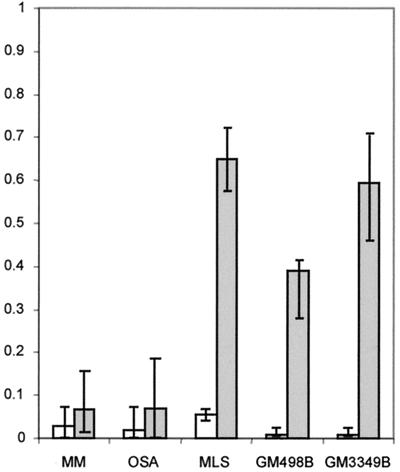
Figure 5.
Formation (white) and elimination rates (gray) of cells carrying mitotically unstable chromosomes in tumor and fibroblast cultures, estimated by the model ΔRDT = F × (1 − RDT) − E × RDT, where ΔRDT is the difference in RDT frequency between two generations, RDT is the RDT frequency at the lower generation number, F is the newly formed fraction/generation, and E is the eliminated fraction/generation. ΔRDT was assumed to be equal to 0 at the average baseline RDT value. E and F values were calculated for each interval between passages during the elimination phase. Median values are indicated by column height, and ranges by vertical bars. The elimination rates were significantly lower in OSA and MM compared with MLS and the fibroblast lines GM498B and GM3349B (P ≤ 0.002; two-tailed Mann–Whitney U test), whereas the formation rates did not differ significantly.

