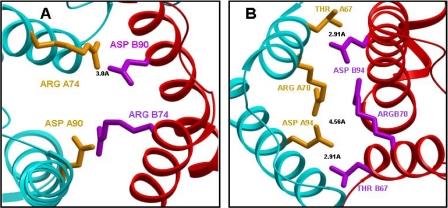
FIGURE 2.
An enlargement of the wild-type human GST π interface showing interacting residues between the two subunits. Subunit A is displayed in cyan and subunit B is in red. A, the distance shown is between Arg-74 (A) (yellow) and Asp-90 (B) (purple) (3.0 Å). B, an enlargement of wild-type GST π interface showing Thr-67, Arg-70, and Asp-94 from both subunits. Subunit A is displayed in cyan and subunit B is in red. The distances shown are between the closest oxygen of Asp-94 (A subunit) and the guanido group of Arg-70 (B subunit) (4.56 Å), and between Thr-67A (A subunit) and Asp-94 (B subunit) (2.91 Å).

