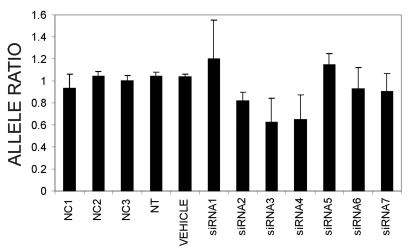
FIGURE 3.
mRNA ratios of the two COL1A2 alleles (allele targeted by siRNAs vs. non-targeted allele) 48 hours post-transfection with seven tiled siRNAs targeting the the T-allele of the COL1A2 exon 6 SNP rs1800222. Shown are mean ratios and standard deviations, derived from PeakPicker analysis of cDNA chromatogram peak heights of two heterozygous SNPs in the COL1A2 gene (rs1800222 and rs412777).

