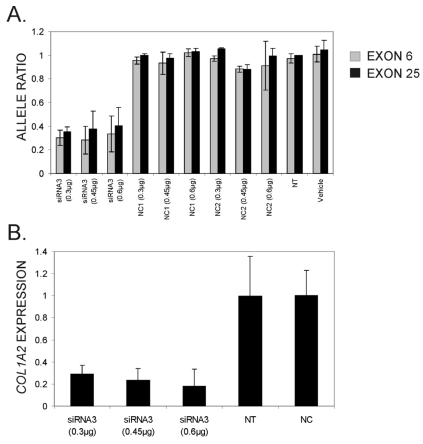
FIGURE 5.
Allele ratios of the two COL1A2 mRNA alleles (normalized cDNA peak heights of targeted vs. non-targeted allele of rs1800222) 72 hours post-transfection with three different concentrations of siRNA3. Colours of bars indicate the SNP used to calculate allele ratios from cDNA chromatograms in the software PeakPicker and error bars indicate standard deviations. (B) Relative overall COL1A2 mRNA levels following siRNA treatment quantified by real-time PCR. Expression levels were normalized for GAPDH levels and are presented relative to COL1A2 mRNA levels in cells treated with the negative control siRNAs (NC1 and NC2). Error bars indicate standard deviations.

