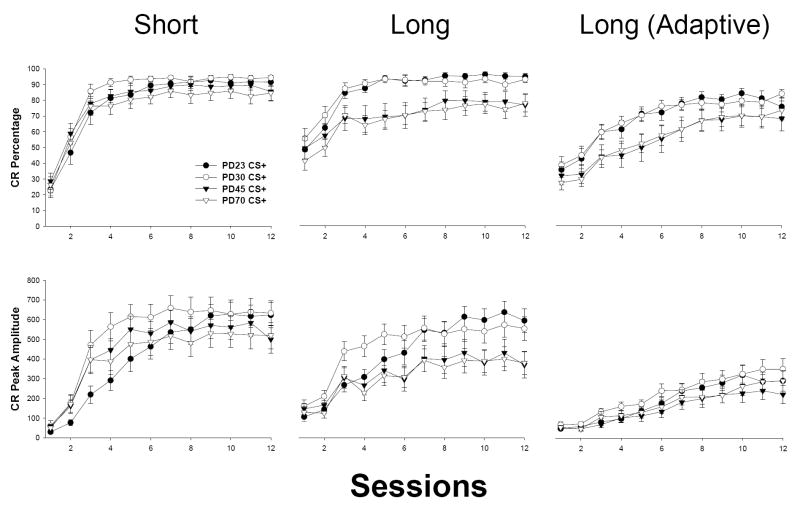
Figure 2.
Mean (± SEM) percentage of total CR frequency (top row) and CR peak amplitude (bottom row) from CS+ trials for subjects trained in interstimulus interval (ISI) discrimination (Experiment 1a). The left column represents CRs for the short CS (280 ms CS-US interval); the middle column represents CRs for the long CS (880 ms CS-US interval); the right column represents adaptively-timed CRs (CRs occurring within the last 200 ms prior to US onset) for the long CS. CR peak amplitude is measured in arbitrary units. PD23 = subjects beginning training on postnatal day 23; PD30 = subjects starting training on postnatal day 30; PD45 = subjects beginning training on (approximately) postnatal day 45; PD70 = subjects beginning training on (approximately) postnatal day 70.

