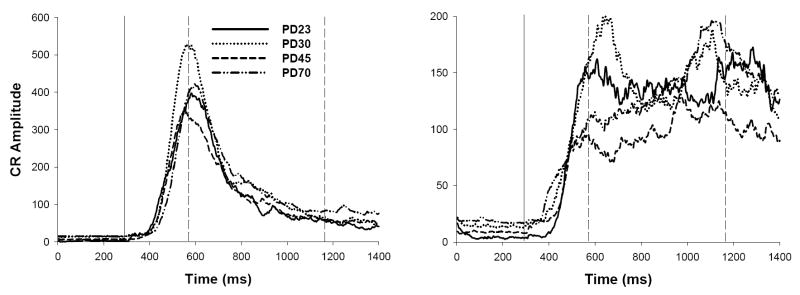
Figure 4.
Tracings of integrated electromyography activity averaged across all short- (280 ms CS-US interval; left) and long-CS-alone probe trials (880 ms CS-US interval; right) following Session 12 for ISI discrimination (Experiment 1a). The solid vertical line represents the onset of the CS, and the two dashed vertical lines represent the onset of the short and long US (time expressed in ms). Note differences in scaling across graphs.

