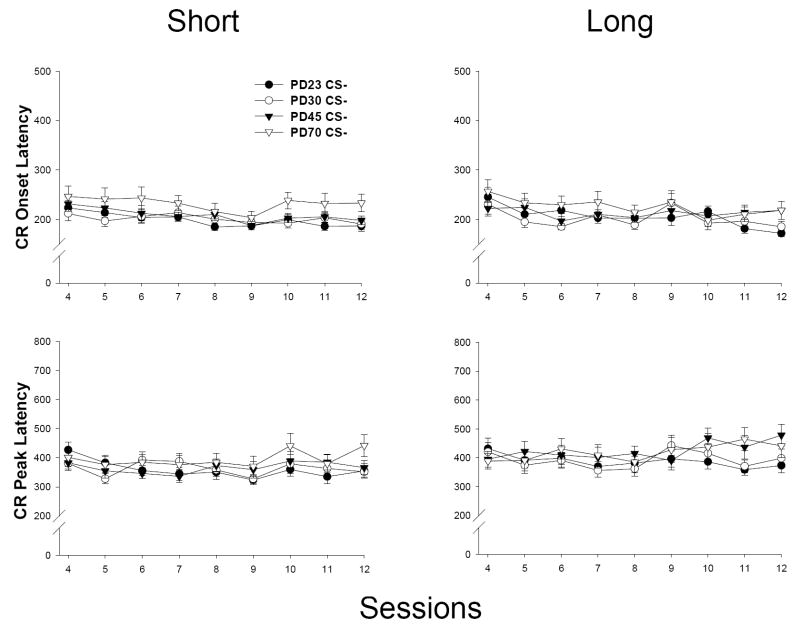
Figure 6.
Mean (± SEM) CR onset latency (in ms; top) and CR peak latency (bottom) from CS-alone trials (Sessions 4-12) for both the short CS (280 ms CS-US interval; left) and the long CS (880 ms CS-US interval; right) in temporal uncertainty (Experiment 1b). Note differences in scaling in onset versus peak latency graphs.

