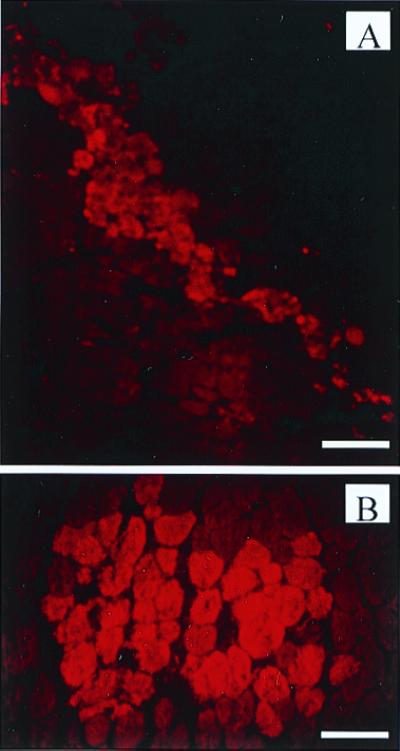
Figure 2.

Distribution of injected chimeraplasts. Muscles injected with Cy3-coupled MDX1 were examined for fluorescent label 24 h after injection. (A) The linear pattern of fluorescent fibers representing the track of the needle through the muscle. (Scale bar represents 120 μm.) (B) A cluster of fluorescently labeled fibers at the injection site. (Scale bar represents 60 μm.)
